


Inherited retinal disorders (IRDs) comprise a genetically and phenotypically diverse group of degenerative diseases that affect photoreceptors and the retinal pigment epithelium (RPE).1 Early manifestations of disease can be clinically subtle, so imaging has become essential for timely and effective diagnosis. The expansion of gene-based and molecular-based therapies has further underscored the importance of identifying reliable biomarkers and characterizing the natural history of diseases. Multimodal imaging including fundus autofluorescence (FAF), near-infrared autofluorescence (NIR-AF), optical coherence tomography (OCT), color fundus photography, and other modalities such as fluorescein angiography, and OCT angiography (OCTA) are helpful for establishing a clinical diagnosis and monitoring for progression.2,3
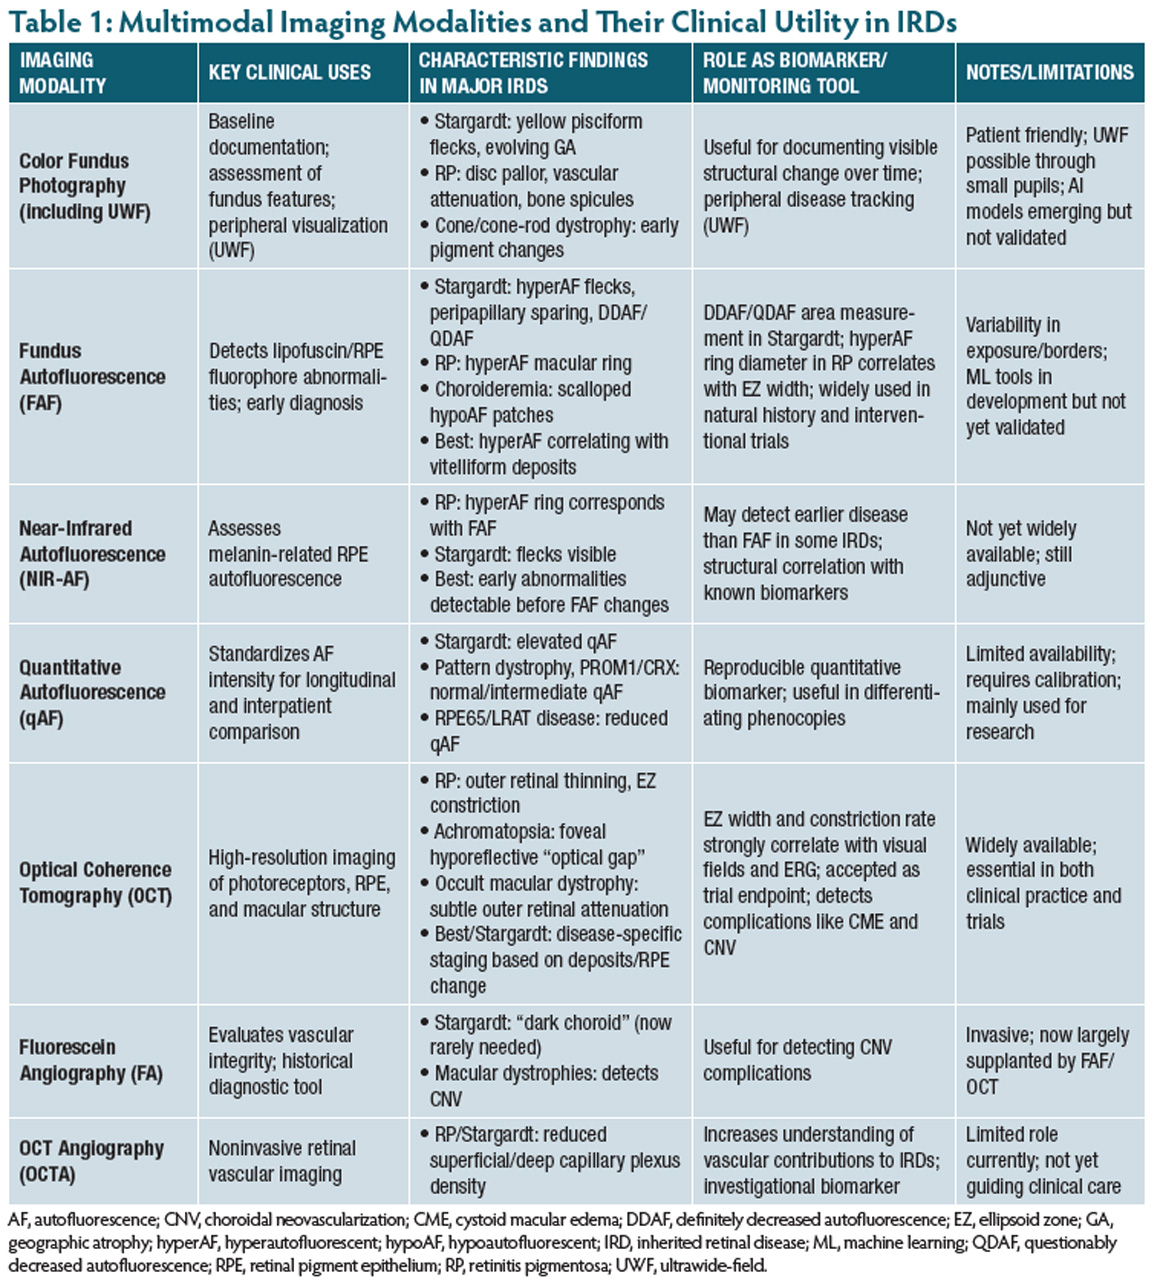
As an increasing number of IRD patients are being identified and referred for genetic testing and counseling, clinicians would benefit from a practical and efficient framework for integrating multimodal imaging into their diagnoses and management. This review summarizes the utility of multimodal imaging across IRDs (Table 1).
Fundus Photography
Color fundus photography has long served as a tool for documenting fundus features and establishing a baseline at time of diagnosis. Newer ultrawidefield imaging systems allow clinicians to capture up to 200° of retina in a single shot, providing immediate access to peripheral abnormalities. This peripheral extension is particularly useful in rod-predominant diseases, such as retinitis pigmentosa (RP), where early degeneration often begins outside of the posterior pole.4
In patients with Stargardt disease, color fundus photos highlight yellow, pisciform flecks that initially accumulate in the posterior pole before later possibly evolving into areas of geographic atrophy. In patients with RP, the classic triad of optic disc pallor, vascular attenuation, and bone spicule pigmentation can be seen. In cone or cone–rod dystrophies, early pigmentary changes can be documented with excellent reproducibility.
Fundus photography remains one of the most patient-friendly imaging options. Ultrawidefield systems often enable imaging through small or undilated pupils, which is particularly advantageous for pediatric patients or those unable to tolerate examination.
Advances in artificial intelligence have further expanded the potential utility of fundus photography. Early studies have demonstrated promising results in classifying IRDs and predicting genotype–phenotype relationships using deep-learning models.5,6 Although these methods remain investigational, they highlight the potential for features on fundus imaging to help distinguish between IRDs.
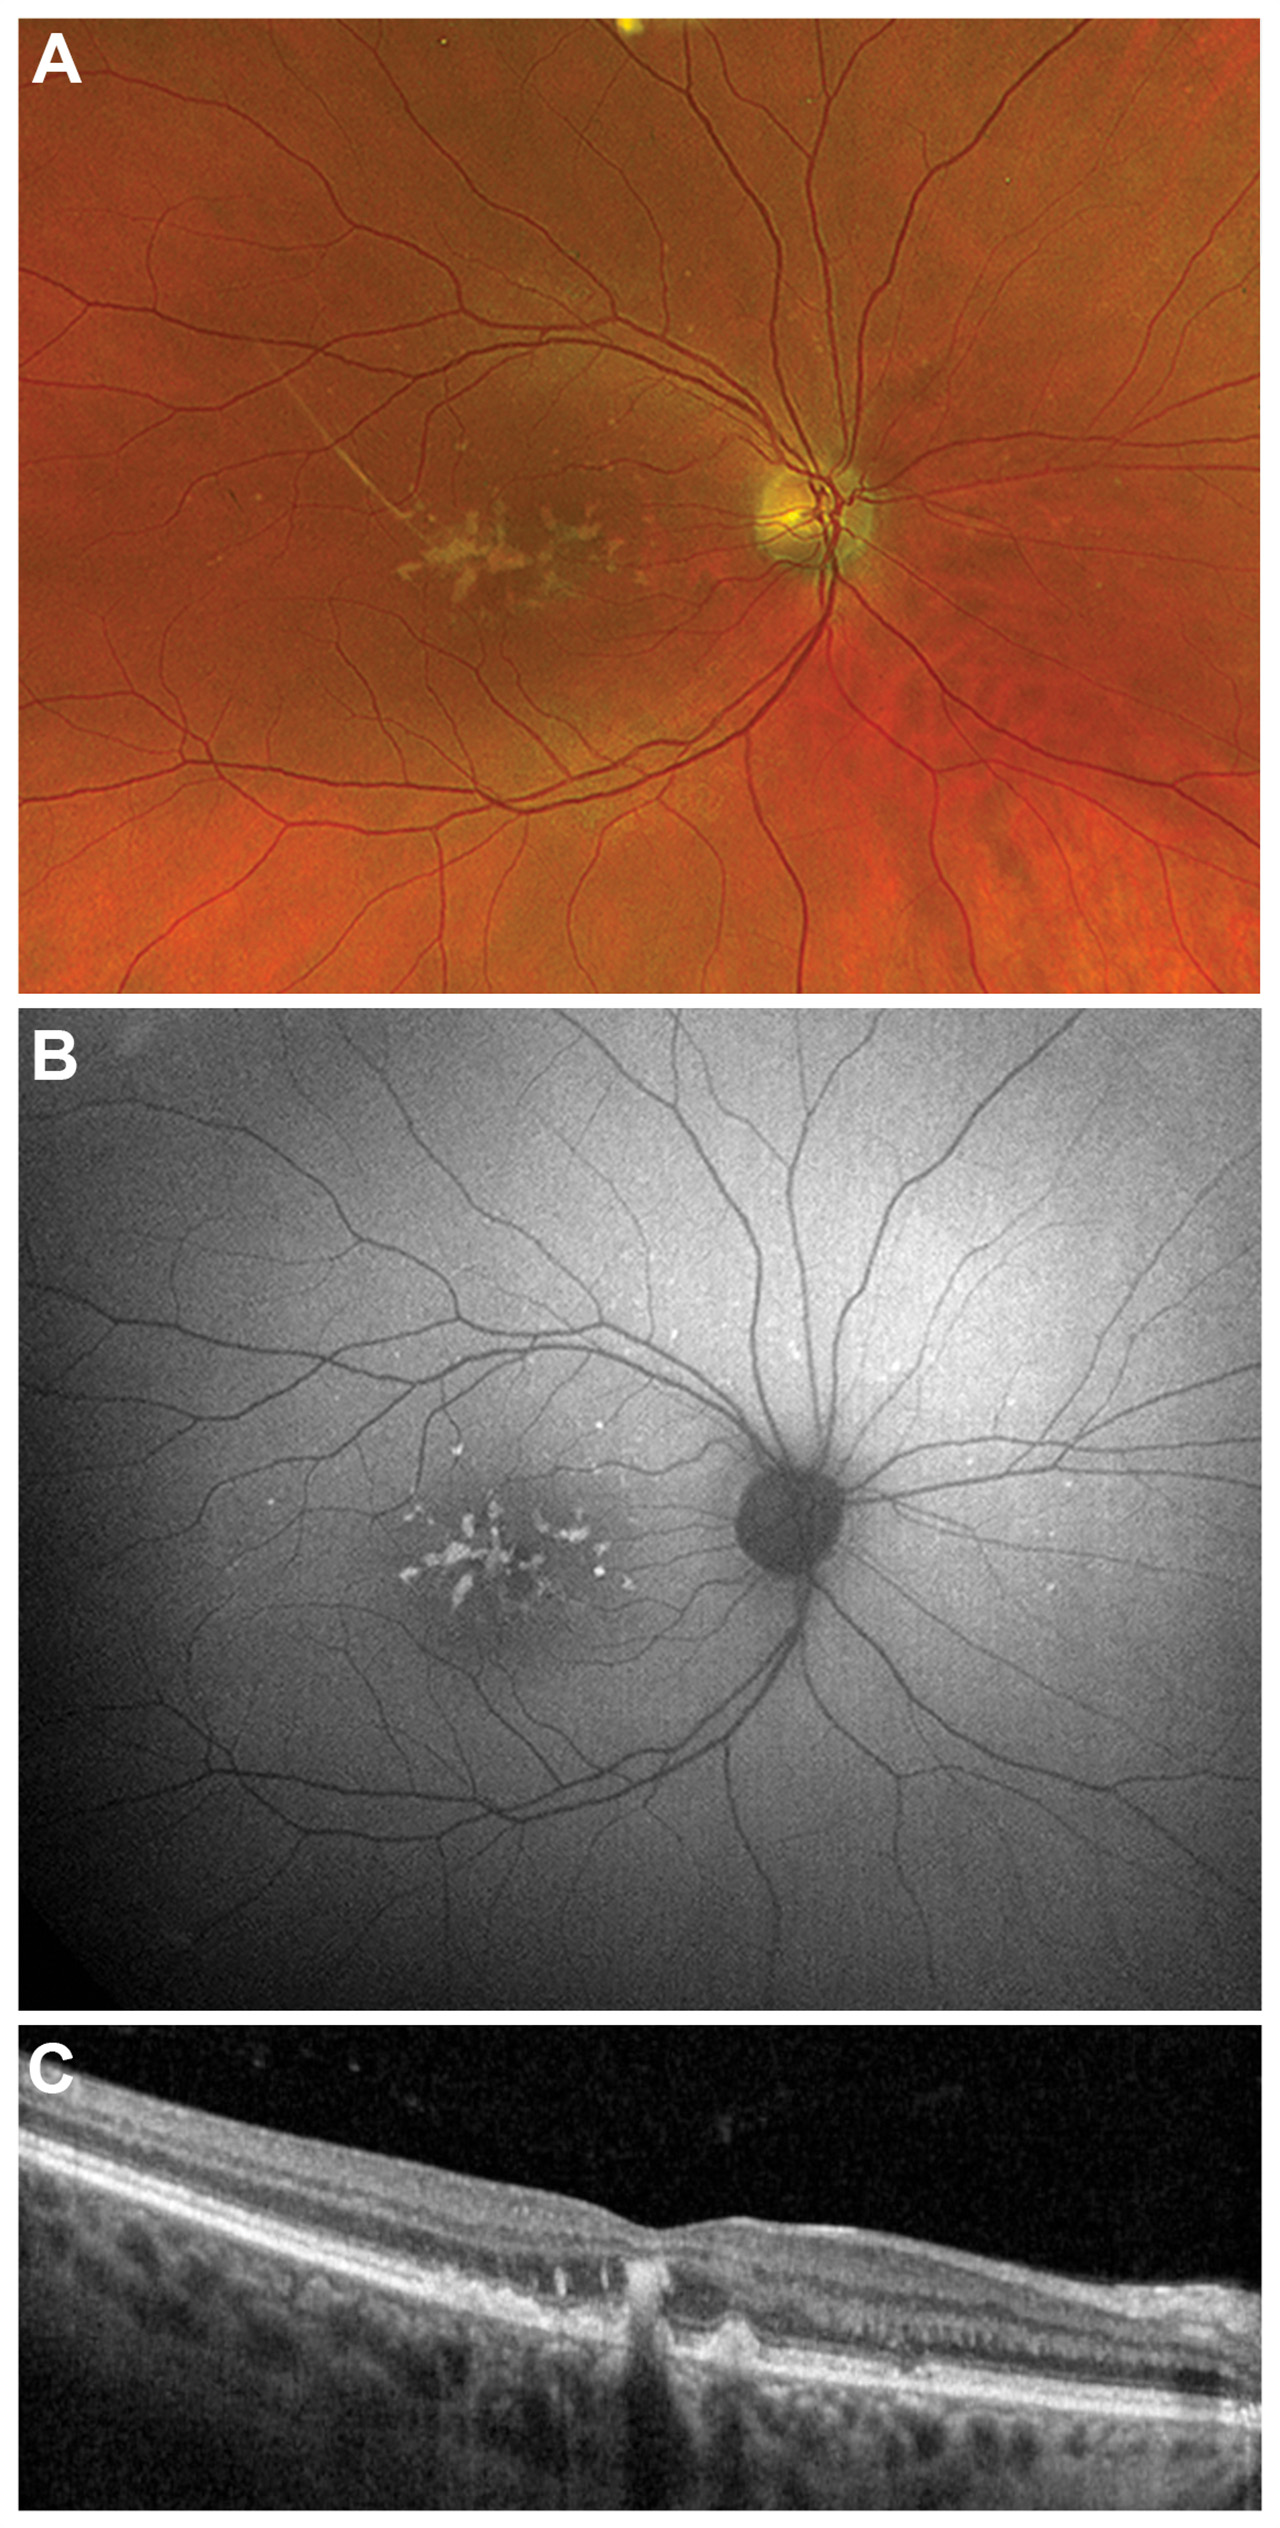
Figure 1. Multimodal imaging in pattern macular dystrophy. Color fundus photography of a patient with pattern macular dystrophy demonstrates yellow drusenoid deposits (A). Fundus autofluorescence demonstrates additional peripheral hyperautofluorescent flecks that are more apparent on this fundus autofluorescence compared to fundus photographs (B). Optical coherence tomography demonstrates that the deposits are both subretinal and intraretinal (C).
Fundus Autofluorescence
FAF has become one of the most informative modalities in the evaluation of IRDs because of its ability to detect lipofuscin and related fluorophores within the RPE that are not always appreciable on exam or color fundus photography.3 Because these fluorophores may accumulate early in disease, FAF can reveal abnormalities that may not be readily visible on clinical examination (Figure 1). This feature allows for the early diagnosis of conditions such as Stargardt disease, pattern macular dystrophy, RP, and Best disease, among others.
In Stargardt disease, FAF highlights hyperautofluorescent flecks caused by excessive bisretinoid accumulation as well as peripapillary sparing, another hallmark of disease. As the disease progresses, hyperautofluorescent flecks transition to hypoautofluorescent lesions, forming areas of definitely decreased autofluorescence (DDAF) and questionably decreased autofluorescence (QDAF).7,8 Serial measurements of these DDAF and QDAF areas enable clinicians to track progression with precision and provides a sensitive and reproducible method for tracking progression over time.7,8 As a result, DDAF and QDAF measurements have become widely adopted in natural history studies and clinical trials evaluating emerging Stargardt therapies.9
FAF also plays an important role in the diagnosis and monitoring of RP. In RP, a hyperautofluorescent ring in the macula commonly demarcates the transition zone between functional and dysfunctional photoreceptors (Figure 2).10 The diameter of this ring correlates closely with ellipsoid zone width on OCT and serves as a useful biomarker for monitoring disease progression and counseling patients regarding their visual prognosis.10
FAF also reveals distinctive patterns across several other IRDs. In choroideremia, for example, FAF shows scalloped patches of hypoautofluorescence progressing centripetally toward the fovea.3 In Best disease, hyperautofluorescence correlates with the presence of subretinal fluid and can be used to help distinguish disease staging, especially in later stages as the vitelliform material settles inferiorly.11
Although machine learning–based approaches to automated FAF interpretation are in development, real-world image variability due to differences in exposure and lesion border definition remains a challenge and limits widespread clinical use currently.12-14 Nevertheless, FAF remains one of the most informative and frequently used modalities for both natural history studies and clinical trials.
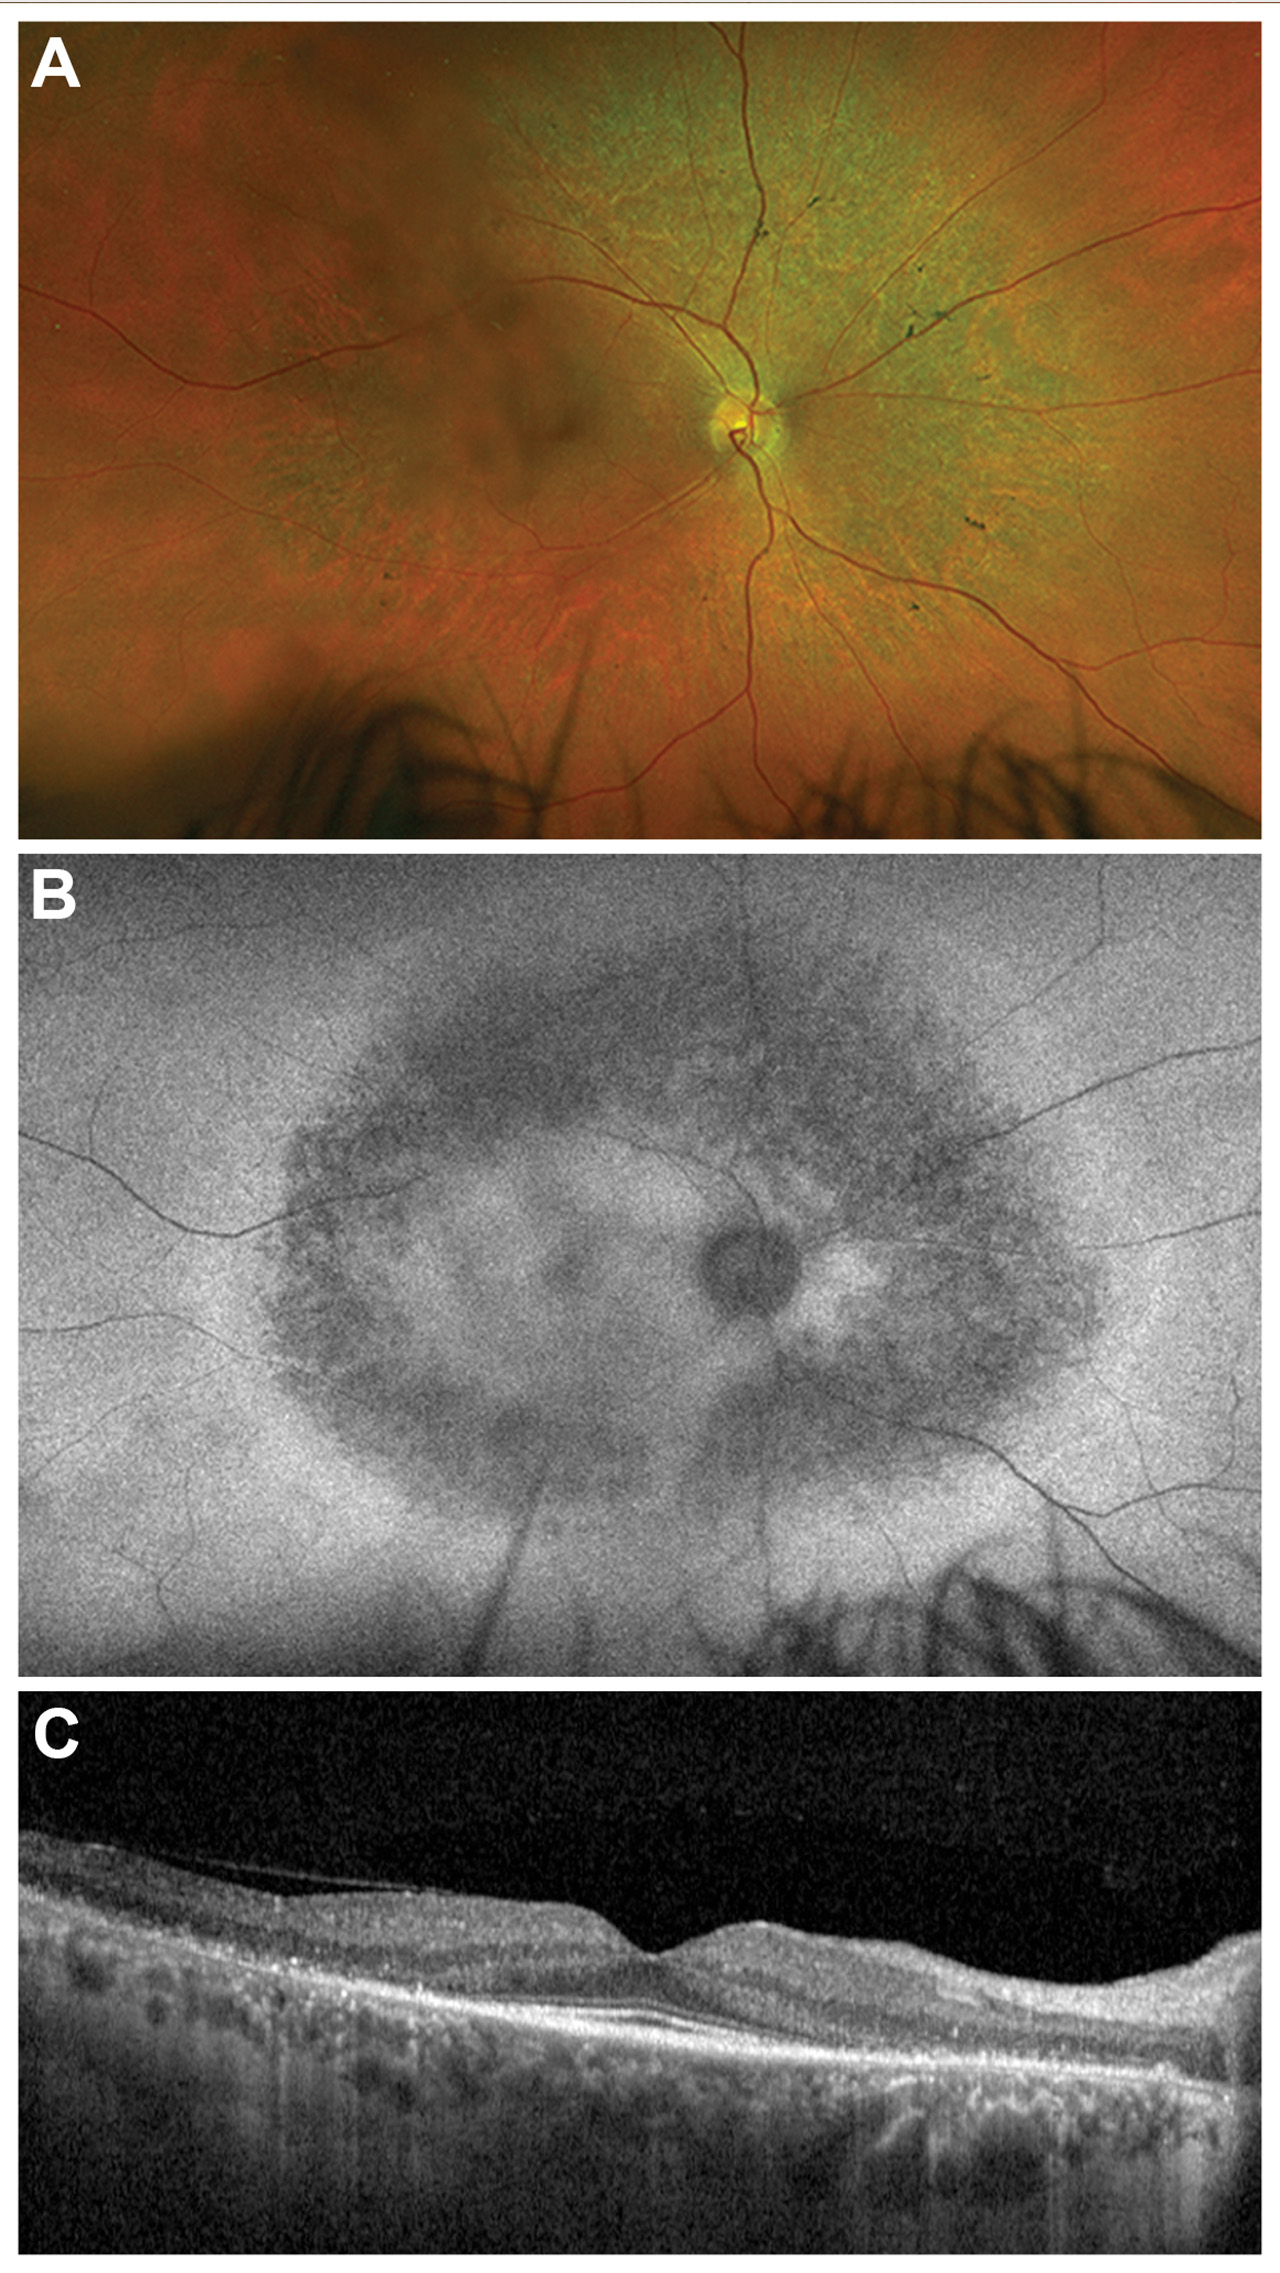
Figure 2. Multimodal imaging in retinitis pigmentosa (RP). Color fundus photographs of a patient with autosomal recessive RP demonstrates mild pallor of the optic nerve, vascular attenuation, and a few bone spicule pigments (A). Fundus autofluorescence illustrates diffuse atrophy in this area and a hyperautofluorescent ring in the midperiphery representing a transition zone between functional and dysfunctional photoreceptors (B). Optical coherence tomography demonstrates outer retinal atrophy correlating with the findings on fundus autofluorescence with a small central island of preserved ellipsoid zone (C).
Near Infrared Autofluorescence and Quantitative Autofluorescence
NIR-AF and qAF have both emerged as separate adjuncts in autofluorescence imaging that provide complementary information to conventional FAF. NIR-AF captures melanin-related autofluorescence from the RPE and has been shown to reliably detect structural abnormalities.15 Studies have demonstrated remarkable structural correlation of disease features such as the hyperautofluorescent ring in RP and pisciform flecks in Stargardt disease between NIR-AF and FAF. NIR-AF has shown promise in Best disease, where decreased NIR-AF can precede visible abnormalities seen with other modalities, suggesting that NIR-AF may serve as an early diagnostic biomarker.15
qAF standardizes autofluorescence intensity by correcting for camera settings, media opacity, and patient factors, allowing for reliable comparison across visits and between individuals. The added level of quantification in qAF is helpful for characterizing changes in intensity of autofluorescence and has shown remarkable utility in differentiating diseases like Stargardt disease, which exhibits elevated qAF levels, from other phenocopies such as pattern dystrophy or macular dystrophies caused by variants in PROM1 or CRX, which demonstrate intermediate or normal qAF levels.16 qAF is also useful in the diagnosis of disorders of the visual cycle where bisretinoid production is reduced, such as Leber congenital amaurosis caused by mutations in RPE65 or LRAT.17
Although NIR-AF and qAF are not routinely available or used in clinical practice, growing evidence supports their utility for early detection and classification of disease.
Optical Coherence Tomography (OCT)
OCT remains integral in the diagnosis and management of IRDs due to its easy accessibility and ability to directly visualize structural changes of the photoreceptors and RPE in the macula. In RP and other rod-cone dystrophies, OCT demonstrates progressive thinning of the outer retina and gradual degradation and constriction of the ellipsoid zone (Figure 2). Numerous studies have demonstrated that the rate of ellipsoid zone constriction correlates with functional decline on visual fields and full-field electroretinography, making it a robust biomarker for disease progression and endpoint for clinical trials.17
OCT also aids in the diagnosis of specific IRDs such as achromatopsia, which often demonstrates a small foveal hyporeflective zone, or “optical gap” in the macula.18 Occult macular dystrophies similarly demonstrate subtle outer retinal attenuation on OCT despite an otherwise normal fundus appearance. OCT-based staging systems for diseases such as Best disease and Stargardt disease rely heavily on patterns of RPE disruption and deposit appearance.18
OCT also plays a critical role in detecting complications of IRDs. These include cystoid macular edema in RP, as well as choroidal neovascularization, which can be seen as a rare complication of Best disease, Sorsby macular dystrophy, or other inherited maculopathies.19
Angiography
Fluorescein angiography (FA) is less commonly used today for diagnostic evaluation of IRDs, although historically it was instrumental in identifying the “dark choroid” associated with Stargardt disease. With advancements in FAF, this sign is now rarely necessary to make a diagnosis. Today, FA retains value in detecting vascular complications, particularly choroidal neovascular membranes, which may occur in certain macular dystrophies.
OCTA provides a noninvasive alternative means of visualizing the retinal vasculature. Studies have demonstrated diminished superficial and deep capillary plexuses in both RP and Stargardt disease, suggesting a vascular component to disease pathophysiology.20 Although OCTA findings in IRDs have yet to translate into significant clinical decision making, they have deepened our understanding of disease mechanisms.
Conclusions
Multimodal imaging has transformed the diagnosis and monitoring of IRDs. Color fundus photographs provide excellent baseline documentation, and FAF, NIR-AF, and qAF can help delineate metabolic abnormalities prior to the appearance of clinical signs. OCT provides highly reproducible structural biomarkers that correlate closely with functional outcomes, and angiographic modalities contribute growing understanding of disease pathophysiology.
As gene and molecular therapies for IRDs progress from trials to clinical practice, the accurate imaging-guided diagnosis and phenotyping of diseases will be essential for the monitoring of disease progression and treatment response. For all retinal physicians caring for patients with IRDs, the integration of multimodal imaging will not only enhance diagnostic precision, but also ensure that patients receive timely and informed guidance in an era of rapidly evolving therapeutic possibilities. RP


References
-
Georgiou M, Robson AG, Fujinami K, et al. Phenotyping and genotyping inherited retinal diseases: molecular genetics, clinical and imaging features, and therapeutics of macular dystrophies, cone and cone-rod dystrophies, rod-cone dystrophies, Leber congenital amaurosis, and cone dysfunction syndromes. Prog Retin Eye Res. 2024;100:101244. doi:10.1016/j.preteyeres.2024.101244
-
Lee BJH, Sun CZY, Ong CJT, et al. Utility of multimodal imaging in the clinical diagnosis of inherited retinal degenerations. Taiwan J Ophthalmol. 2024;14(4):486-496. doi:10.4103/tjo.TJO-D-24-00066
-
Oh JK, Moussa O, Lam BL, Sengillo JD. Fundus autofluorescence in inherited retinal disease: a review. Cells. 2025;14(14):1092. doi:10.3390/cells14141092
-
Midena E, Marchione G, Di Giorgio S, Rotondi G, Longhin E, Frizziero L, et al. Ultra-wide-field fundus photography compared to ophthalmoscopy in diagnosing and classifying major retinal diseases. Sci Rep. 2022;12:19287.
-
Antaki F, Coussa RG, Kahwati G, Hammamji K, Sebag M, Duval R. Accuracy of automated machine learning in classifying retinal pathologies from ultra-widefield pseudocolour fundus images. Br J Ophthalmol. 2023;107(1):90-95. doi:10.1136/bjophthalmol-2021-319030
-
Jafarbeglou F, Ahmadieh H, Soleimani F, et al. A deep learning model for diagnosis of inherited retinal diseases. Sci Rep. 2025;15(1):22523.
-
Strauss RW, Muñoz B, Ho A, et al. Progression of Stargardt disease as determined by fundus autofluorescence in the retrospective progression of Stargardt Disease Study (ProgStar Report No. 9). JAMA Ophthalmol. 2017;135(11):1232-1241. doi:10.1001/jamaophthalmol.2017.4152
-
Strauss RW, Ho A, Jha A, et al. Progression of Stargardt disease as determined by fundus autofluorescence over a 24-month period (ProgStar Report No. 17). Am J Ophthalmol. 2023;250:157-170. doi:10.1016/j.ajo.2023.02.003
-
Phase 3, randomized, placebo-controlled study of tinlarebant to explore safety and efficacy in adolescent Stargardt disease (DRAGON). Clinicaltrials.gov identifier: NCT05244304. Updated October 31, 2025. Accessed November 25, 2025. https://clinicaltrials.gov/study/NCT05244304
-
Cabral T, Sengillo JD, Duong JK, et al. Retrospective analysis of structural disease progression in retinitis pigmentosa utilizing multimodal imaging. Sci Rep. 2017;7(1):10347.
-
Lima de Carvalho JR Jr, Oh JK, Ragi S, et al. Multimodal imaging and dark-adapted chromatic perimetry in BEST1 vitelliform macular dystrophy: identification of outcome measurements. Ophthalmol Sci. 2025;5(5):100823. doi:10.1016/j.xops.2025.100823
-
Naik G, Al-Khuzaei S, Moghul I, et al. Retinograd-AI: an open-source automated fundus autofluorescence retinal image gradability assessment for inherited retinal diseases. Ophthalmol Sci. 2025;5(6):100845. doi:10.1016/j.xops.2025.100845
-
Kuehlewein L, Hariri AH, Ho A, et al. Comparison of manual and semiautomated fundus autofluorescence analysis of macular atrophy in Stargardt disease phenotype. Retina. 2016;36(6):1216-1221. doi:10.1097/IAE.0000000000000870
-
Zhao PY, Branham K, Schlegel D, Fahim AT, Jayasundera KT. Automated segmentation of autofluorescence lesions in Stargardt disease. Ophthalmol Retina. 2022;6(11):1098-1104. doi:10.1016/j.oret.2022.05.020
-
Kellner S, Weinitz S, Farmand G, Kellner U. Near-infrared autofluorescence: early detection of retinal pigment epithelial alterations in inherited retinal dystrophies. J Clin Med. 2024;13(22):6886. doi:10.3390/jcm13226886
-
Sparrow JR, Duncker T, Schuerch K, Paavo M, de Carvalho JRL Jr. Lessons learned from quantitative fundus autofluorescence. Prog Retin Eye Res. 2020;74:100774. doi:10.1016/j.preteyeres.2019.100774
-
Oh JK, Lima de Carvalho JR Jr, Ryu J, Tsang SH, Sparrow JR. Short-wavelength and near-infrared autofluorescence in patients with deficiencies of the visual cycle and phototransduction. Sci Rep. 2020;10(1):8998.
-
Gómez-Benlloch A, Garrell-Salat X, Cobos E, et al. Optical coherence tomography in inherited macular dystrophies: a review. Diagnostics (Basel). 2024;14(9):878.
-
Patel RC, Gao SS, Zhang M, et al. Optical coherence tomography angiography of choroidal neovascularization in four inherited retinal dystrophies. Retina. 2016;36(12):2339-2347. doi:10.1097/IAE.0000000000001159
-
Ong SS, Patel TP, Singh MS. Optical coherence tomography angiography imaging in inherited retinal diseases. J Clin Med. 2019;8(12):2078. doi:10.3390/jcm8122078